
Rental Property Calculator —
Real Cash Flow, Honest Reserves.
Run a buy-and-hold rental in 60 seconds. Cash flow, cash-on-cash, cap rate, DSCR, NOI — with maintenance, CapEx, and vacancy reserves baked in. Built by a landlord with 70+ doors, not a SaaS company.
Defaults: 30-year amortization, 5% vacancy, 8% property management, 5% maintenance reserve, 5% CapEx reserve, $4k closing costs. Sign up to override every assumption.
What You're Seeing Above is ~10% of the Product.
The free preview runs the same math as the full tool — it just exposes a fraction of the inputs and none of the operational features. Here's what the full Value Add Calculator ships with:
No card charged until day 15. Cancel any time.
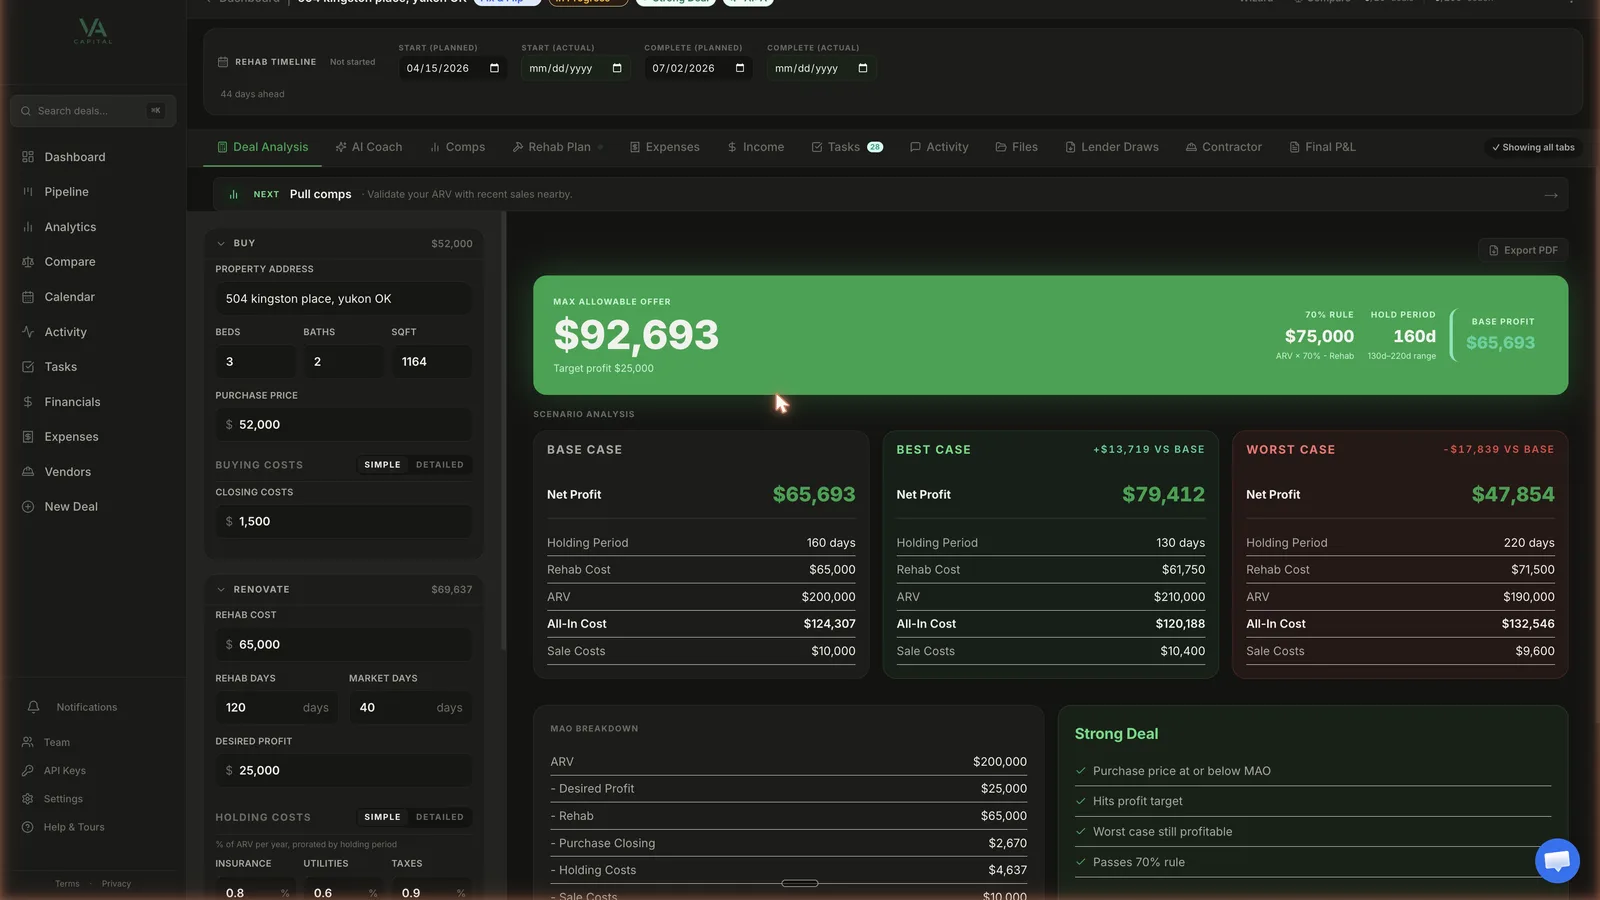
The Actual Deal Page You Get After Signup.
Sidebar nav · AI Deal Grade · full input panel · live results · scope of work · comps · expense tracker · tasks · activity feed · branded PDF export.
How Rental Analysis Actually Works
Rental underwriting is two layers. The deal pencils on a spreadsheet or it doesn't. Then it has to keep penciling for 30 years through tenant turnover, capital expenditures, and the year the AC dies in July.
Income. Gross monthly rent plus any side income (laundry, pet, parking). Subtract vacancy — typically 5% on a stabilized rental in a tight market, 8% on a soft one, 10%+ on a unit that turns every 12 months. That gives you effective gross income.
Operating expenses. Property management, taxes, insurance, utilities (if landlord-paid), HOA, and the two reserves nobody wants to count: maintenance and CapEx. Real-world maintenance on a 1980s+ build runs 5% of gross rent over a 10-year hold. CapEx — the long-cycle replacements like roof, HVAC, water heater, appliances — runs another 5%. If you do not reserve for them monthly, you are paying them out of pocket the year they break.
NOI. Effective gross income minus operating expenses. This is the number a bank looks at. It is also what cap rate is calculated against. NOI does not include mortgage payment — that is the whole point.
Mortgage.Real 30-year amortization on your loan balance at your input rate. Not interest-only. Not estimated. The full P&I payment. Subtract it from NOI and you have monthly cash flow.
Cash flow. The number in your pocket every month, after every operating expense and the mortgage. $200/mo on a single-family rental is the bar. Below that and the next $1,200 work order eats six months of cash flow.
Cash-on-cash return. Annual cash flow divided by total cash in (down payment + closing + any upfront rehab). This is the return on your actual money. I look for 8%+ on a stabilized SFR rental. 10%+ on a value-add play after rehab is done.
The trap on rentals is that the spreadsheet always looks better than the reality. Calculators that skip CapEx (Calculator.net) or let you zero out maintenance (BiggerPockets default) produce a phantom positive cash flow. Three years in, the water heater dies, you spend $1,200, and that year's cash flow goes negative on a deal you thought was clearing $250/mo.
The Reserves Most Calculators Skip
Run the same deal through Calculator.net's rental calculator and this one. Two different cash flow numbers. The difference is reserve math.
- Maintenance reserve (default 5% of gross rent). Small repairs, turnover paint, plumbing calls, the dishwasher that breaks. Over a 10-year hold on a 1980s+ build, this averages 5% of gross rent. Some years it is 2%, the year a tenant trashes the unit it is 12%. The reserve smooths it.
- CapEx reserve (default 5% of gross rent). The long-cycle replacements. Roof every 25 years. HVAC every 15. Water heater every 10. Appliances every 12. Spread those costs across the rent and it is roughly 5% of gross. Calculator.net's default is zero. That is why the cash flow they show is fiction.
- Vacancy reserve (default 5%). A unit goes vacant when a tenant leaves. Two weeks of turnover at minimum on a smooth turn, sometimes 6 weeks on a tough one. 5% is realistic for a stabilized rental in OKC. 8%+ in markets with high tenant turnover.
- Property management (default 8%). If you self-manage, you can zero this out — but you should price your own time at 8% of gross rent because that is what you will pay when you finally hire it out. Most landlords self-manage for the first 5 units, then realize their time is worth more than 8%.
When all four reserves are honest, the deal that calculator.net says cash-flows $400/mo cash-flows $80/mo in the real world. The deal calculator.net says cash-flows $80/mo is actually negative.
Defaults on the calculator above are conservative on purpose. You can edit any of them. But the version that ships out of the box is the version that matches what 70+ units of operational experience actually look like.
NOI vs Cash Flow vs CoC vs Cap Rate vs DSCR — What Actually Matters
Every rental metric answers a different question. Knowing which one to look at when is half the underwriting skill.
- NOI — "Is this property generating real income?" Income minus operating expenses, before mortgage. Banks underwrite against this. Cap rate is calculated from it.
- Cash flow — "Are dollars in my pocket every month?" NOI minus mortgage. This is the actual money. $200/mo is the floor I want on a single-family rental.
- Cap rate — "How does this deal compare to others at different leverage levels?" NOI divided by purchase price. Useful for comparing across deals. Less useful for evaluating a single deal in isolation because it ignores financing.
- Cash-on-cash — "What is my return on the actual cash I put in?" Annual cash flow divided by total cash in. This is the metric I rank deals by. 8%+ is the bar on stabilized SFR. 12%+ is exceptional.
- DSCR — "Will a bank refinance this?" NOI divided by annual mortgage payment. Most DSCR lenders require 1.25 minimum. If your DSCR is 1.10 your deal cash-flows but you cannot refinance into a DSCR loan, which constrains your exit options.
- Break-even occupancy — "How far can occupancy drop before I am bleeding?" The percentage occupancy needed to cover operating expenses + mortgage. Below 80% break-even is comfortable. Above 90% means a single bad turn can push the deal negative for the month.
I look at all of them. Cash-on-cash drives the ranking. Cash flow tells me if I can survive a bad month. DSCR tells me if I can refinance. Break-even occupancy tells me how thin the margin is.
What You Get When You Sign Up
The free calculator runs one rental. The paid tool runs your portfolio.
Solo $59/mo · Pro $149/mo · Team $299/mo · No card charged for 14 days
Built by a Landlord with 70+ Doors
I'm Cam Burke. I operate 70+ rental units in Oklahoma City through Tuff Holdings. Single-family, small multi, value-add deals after BRRRRs, conventional and DSCR financing across the portfolio.
The first rental calculator I used was BiggerPockets'. The default settings let me show a $300/mo cash flow on a deal I later realized was clearing $40/mo when I actually tracked expenses for two years. CapEx reserve was zero. Maintenance was 2%. Vacancy was 4%. Every number was rosy because the platform makes money from people feeling good about their deals.
The calculator on this page defaults to honest reserves because I've eaten the wrong defaults. 5% maintenance, 5% CapEx, 5% vacancy are the rates that match what the portfolio actually does over a 10-year hold. The verdict at the top of the calculator — Strong / Marginal / Weak — uses real-world thresholds, not feel-good ones.
When you sign up, the full version saves every deal, rolls them into a portfolio dashboard, lets you track expenses against budget once a property is in service, and exports DSCR-ready PDFs for refinances. Same engine as the calculator above — the numbers don't move.